Since I am always curious about what the traffic is on this very site that you are visiting now, I figured that some sort of device that would monitor the pageviews on the site and display the current view count would be a perfect next project on my IoT journey.
Doing some research, I found that it was fairly easy to display view counts for certain sites like YouTube or Instructables.com since those particular sites offer custom API (Application Programming Interface) services that make obtaining that data a relatively simple matter of one or 2 lines of software code on your IoT device.
While on the surface it did seem that making a device to display the page view counts of the website, I quickly discovered that while it is pretty easy to use API calls for those web sites, there are no API's out there that will work for ANY website.
So clearly I needed to find a way to have my IoT device talk to my website in order to tell me how many visitors.
I happen to use Google Analytics as a way to see what my site traffic is and where in the world my site visitors are from, among other things. As it happens, one of the metrics that Google Analytics captures is my total page views.
Alas, when looking into the Google Analytics tool, I still could not find an easy way to make an API call directly to Google Analytics to get that data.
After some more digging, I figured that the easiest way to get my web site pageview data to my IoT device was to move the data through a couple of steps such that:
- The source of my data will be Google Analytics
- I noticed that Google Sheets - which is a companion to Google Docs - can easily "talk" to Google Analytics, so the plan is to build a Google Sheets report that will read Google Analytics and create a report on the current pageviews for my website.
- I also noticed that this is still not an easy way to use an API call on Google Sheets, so I will use ThingSpeak to create an API to read the Google Sheets report.
- Finally, I would then program/ a NodeMCU device to read the Thingspeak API and display my pageviews.
Since there are a lot of "moving" parts here, I will break this up into a few parts, starting with creating the Google Sheets report.
I will warn you, that this post will dive more into my day job as an IT guy, but like painting a room, we need to do prep work before we can do the fun part. So trust me, we will end up back in the shop at the end of this project.
I will warn you, that this post will dive more into my day job as an IT guy, but like painting a room, we need to do prep work before we can do the fun part. So trust me, we will end up back in the shop at the end of this project.
Getting started with Google Sheets
Getting started with Google Sheets is actually pretty straight forward.
I simply logged onto my Google Account and did a search for Google Sheets.
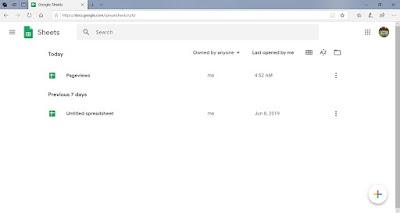
Clicking on the link for Google Sheets in the search results, I got placed into the Google Sheets dashboard screen.
To create a new spreadsheet, I just simply clicked on the "plus" sign icon on the bottom right-hand side of the screen.
Clicking on the icon opens up a spreadsheet that should be very familiar to anyone that have used Excel spreadsheets before.
In fact, at this point, you could go ahead and create whatever spreadsheet you like, secure in the fact that your data will be safely stored in the internet cloud as part of your Google account.
But in our case we really wanted our spreadsheet to talk to Google Analytics about my Pageview data.
To this, we first need to add a plug-in module to allow the spreadsheet to talk to Google Analytics.
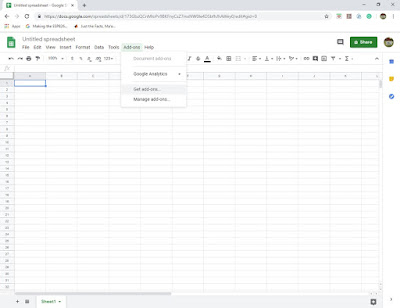
To do this we first click on the Add-ons menu item at the top of the spreadsheet.
Within the Add-On menu, we click our mouse on the "Get add-ons" option
This opens up a huge library of add-ons that we could use with our spreadsheet, but a quick search of "Google Analytics" quickly brings the add on that we need to the top of the list.
Clicking on the "+Free" button beside Google Analytics installs the plugin that we need.
With the plugin installed, we now need to make use of it.
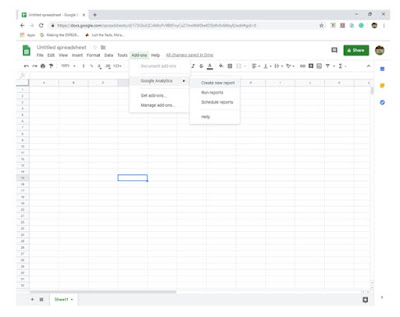
Once again, I clicked on the Add-On menu, and now I see a menu entry for Google Analytics.
Clicking on that produces a submenu for selection.
Since I wanted to create a new report, I selected that option.
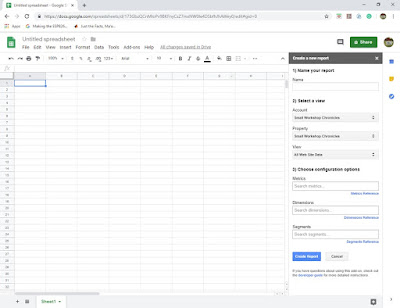
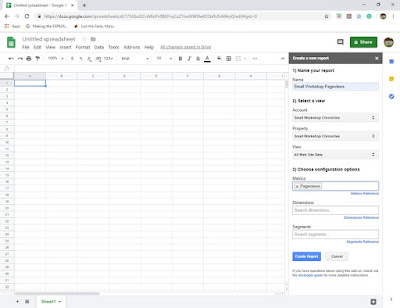
I was next presented with a sidebar of options that I could use to define my reports.
The plugin is already pointing to my Google Analytics account since Google Analytics is tied to my Google account.
I started with the easy stuff first - the name for my report
After that, I indicated what metrics I wanted to display on my report.
Clicking on the Metrics field provides a drop-down list of all the metrics that are available on Google Analytics. You can select as many metrics that you would like to report on.
In my case, I only want to get my Pageviews, so I selected that from the drop-down list.
With my selections complete, I clicked on the Create Report button.
I was then presented with a Report Configuration sheet that provided me with the parameters that have been defined for my report.
Right off the bat, I did notice a slight problem - the Start Date for my report was set as 30 Days Ago.
Since I wanted my Pageviews to be for the entire time that my site's been active, I needed to change that.
Fortunately, since this is pretty much a standard spreadsheet, I just clicked on the field that held the value of "30 Days Ago" and changed it to a date value that was sometime before I created my website. Hitting the Enter key after I filled in the value and the fix was complete.
With the report now configured to display what we want to see, we can now run the report.
Clicking once more on the Add-ons menu, once again click on the Google Analytics options and this time click on the Run Reports command
If everything goes well, you should see a "Success" message...
and a report should now be visible showing what my current Pageviews are.
So now I have a shareable report that can display what my current Pageviews are.
The issue now is that this is only going to report on what my Pageviews are at this particular point in time. In order for this to be useful for my Page Visitor Counter, I need to have it so that the report is updated at regular intervals.
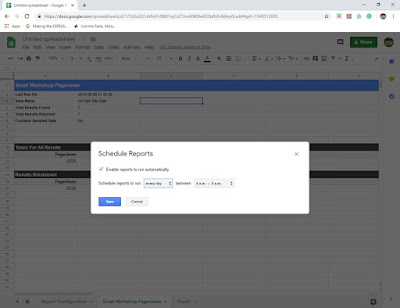
Thankfully Google Sheets does have a feature to run your reports in a schedule. To do that I once again had to click on the Add-ons menu item, click on Google Analytics one more time and select Schedule Reports from the submenu.
You are then given a pop-up box that allows you to specify when to schedule the report. In my particular case, I have the report run daily at 4am.
With that, I now have at least a way to get a Pageview from an easily shareable source. Sadly, however, there isn't really an easy way to create an API directly from Google Sheets that my counter can use to access the data.
So, the search is now on for a way to hook my counter up to my Google Sheets report.








No comments:
Post a Comment